Monday, January 30, 2023

BITS-WILP-DSAD-Regular-2023-Mid Semester


---------------------------------------------------------------------------- 
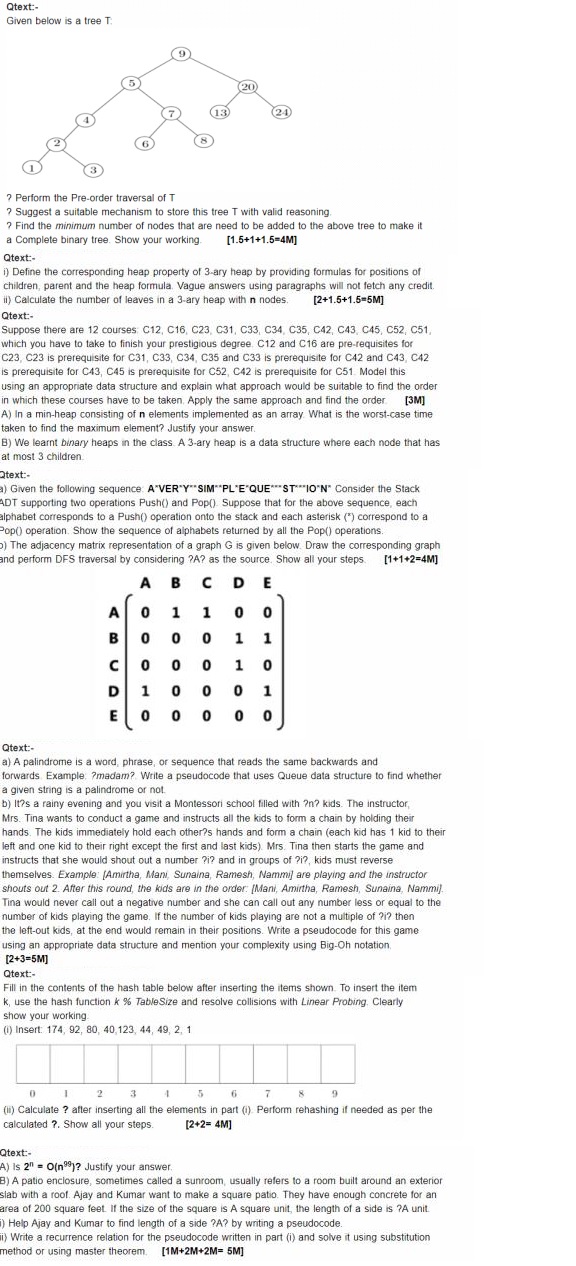
All the messages below are just forwarded messages if some one feels hurt about it please add your comments we will remove the post. Host/author is not responsible for these posts.

BITS-WILP-MFDS-Regular 2023 - Jan 2023- Mid semester


---------------------------------------------------------------------------- 
All the messages below are just forwarded messages if some one feels hurt about it please add your comments we will remove the post. Host/author is not responsible for these posts.

Tuesday, January 24, 2023

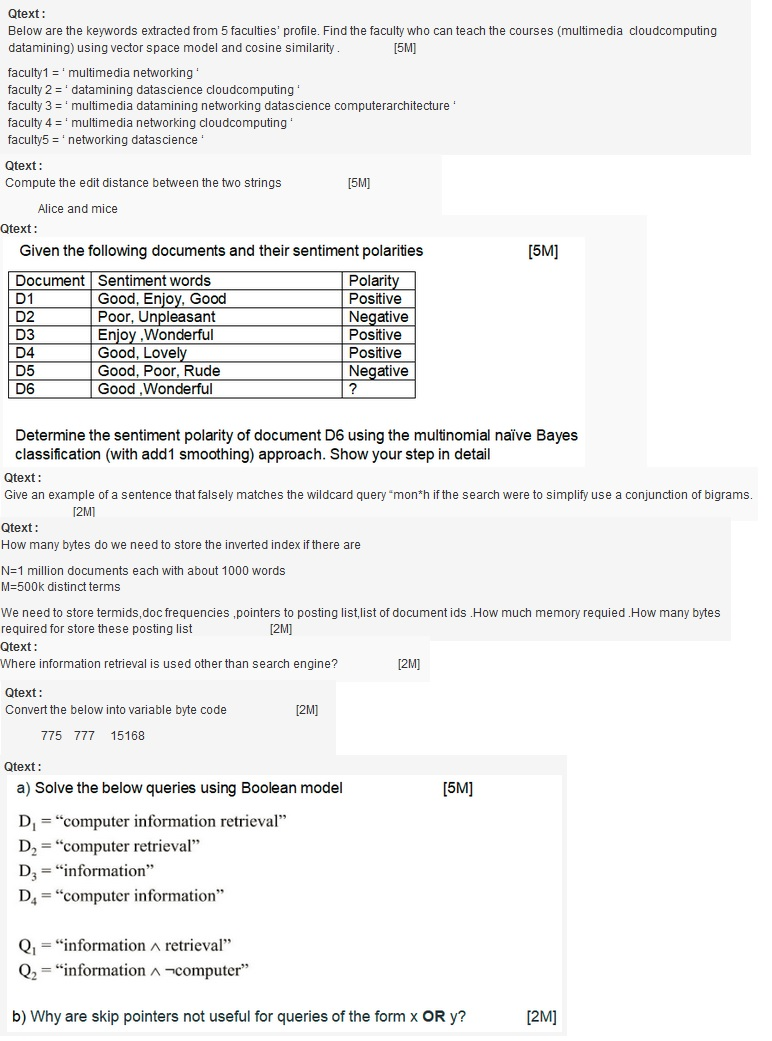
Midsemester - Information Retrieval -- DSECLZG537 - Jan 7th 2023

Information Retrieval - Regular - Mid Semester conducted on 7th Jan 2023


---------------------------------------------------------------------------- 
All the messages below are just forwarded messages if some one feels hurt about it please add your comments we will remove the post. Host/author is not responsible for these posts.

Monday, January 23, 2023

Regular - Mid Semester - Deep Learning - DSECLZG524 - 7th Jan 2023

Regular - Mid Semester - Deep Learning - DSECLZG524 - 7th Jan 2023


---------------------------------------------------------------------------- 
All the messages below are just forwarded messages if some one feels hurt about it please add your comments we will remove the post. Host/author is not responsible for these posts.

Sunday, January 22, 2023

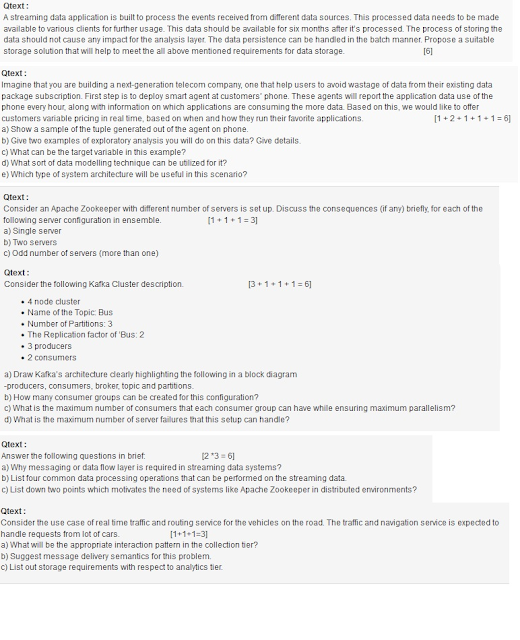
Midsemester - Regular - SPA - Question Paper

BITS - Mid Semester - SPA - Regular - 21st Jan 2023


---------------------------------------------------------------------------- 
All the messages below are just forwarded messages if some one feels hurt about it please add your comments we will remove the post. Host/author is not responsible for these posts.

Tuesday, January 17, 2023

Data Delivery Semantic - SPA

Data Delivery Semantic

Three options for data delivery and processing
 At most once delivery
 At least once delivery
 Exactly once delivery

At most once delivery semantic

• Systems used for monitoring purposes
• Important to inform the admins about the problems
• Not all data transmissions required
• Down-sample the data to improve performance
• Data loss is approximately known

Exactly once delivery semantic

• Financial systems or advertising systems
• Every message has to be delivered only once
• Data loss not affordable as it might be revenue loss
• Achieved through queuing systems like ActiveMQ, RabbitMQ
• Usually queue semantics implemented on server side

At least once delivery semantic

• Balance two extremes by providing reliable message delivery by pushing the message handling
semantics to the consumer
• Consumers are free to implement message handling without bothered about other consumers
• Dependent on application logic and handled in application level only


---------------------------------------------------------------------------- 
All the messages below are just forwarded messages if some one feels hurt about it please add your comments we will remove the post.Host/author is not responsible for these posts.

Kappa Architecture - SPA


Kappa Architecture

• The idea is to handle both real-time data processing and continuous reprocessing in a single
stream processing engine.
• This requires that the incoming data stream can be replayed (very quickly), either in its entirety
or from a specific position.
• If there are any code changes, then a second stream process would replay all previous data
through the latest real-time engine and replace the data stored in the serving layer.
• This architecture attempts to simplify by only keeping one code base rather than manage one
for each batch and speed layers in the Lambda Architecture.
• In addition, queries only need to look in a single serving location instead of going against batch
and speed views.


Pros
• Kappa architecture can be used to develop data systems that are online learners and
therefore don’t need the batch layer.
• Re-processing is required only when the code changes.
• It can be deployed with fixed memory.
• It can be used for horizontally scalable systems.
• Fewer resources are required as the machine learning is being done on the real time basis.
Cons
• Absence of batch layer might result in errors during data processing or while updating the
database that requires having an exception manager to reprocess the data or reconciliation.


---------------------------------------------------------------------------- 
All the messages below are just forwarded messages if some one feels hurt about it please add your comments we will remove the post.Host/author is not responsible for these posts.

Lambda Architecture -- SPA

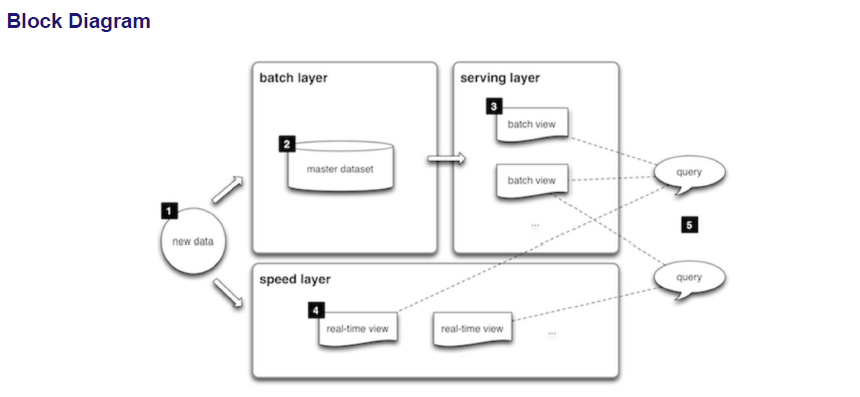
Basic Flow of Events Of Lamda Architecture

All data entering the system is dispatched to both the batch layer and the speed layer for
processing.
2. The batch layer has two functions:
(i) managing the master dataset (an immutable, append-only set of raw data)
(ii) to pre-compute the batch views.
3. The serving layer indexes the batch views so that they can be queried in low-latency, ad-hoc
way.
4. The speed layer compensates for the high latency of updates to the serving layer and deals
with recent data only.
5. Any incoming query can be answered by merging results from batch views and real-time views

Batch Layer

New data comes continuously, as a feed to the data system.
• It gets fed to the batch layer and the speed layer simultaneously.
• It looks at all the data at once and eventually corrects the data in the stream layer.
• Here we can find lots of ETL and a traditional data warehouse.
• This layer is built using a predefined schedule, usually once or twice a day.
• The batch layer has two very important functions:
• To manage the master dataset
• To pre-compute the batch views.


Speed Layer (Stream Layer)

• This layer handles the data that are not already delivered in the batch view due to the latency of
the batch layer.
• In addition, it only deals with recent data in order to provide a complete view of the data to the
user by creating real-time views.
• Speed layer provides the outputs on the basis enrichment process and supports the serving
layer to reduce the latency in responding the queries.
• As obvious from its name the speed layer has low latency because it deals with the real time
data only and has less computational load.

Serving Layer

• The outputs from batch layer in the form of batch views and from speed layer in the form of
near-real time views are forwarded to the serving layer.
• This layer indexes the batch views so that they can be queried in low-latency on an ad-hoc
basis.

 Pros
• Batch layer of Lambda architecture manages historical data with the fault tolerant
distributed storage which ensures low possibility of errors even if the system crashes.
• It is a good balance of speed and reliability.
• Fault tolerant and scalable architecture for data processing.
 Cons
• It can result in coding overhead due to involvement of comprehensive processing.
• Re-processes every batch cycle which is not beneficial in certain scenarios.
• A data modelled with Lambda architecture is difficult to migrate or reorganize.


---------------------------------------------------------------------------- 
All the messages 
below are just forwarded messages if some one feels hurt about it please add your comments we will remove the post.Host/author is not responsible for these posts.

Generalized Architecture - SPA

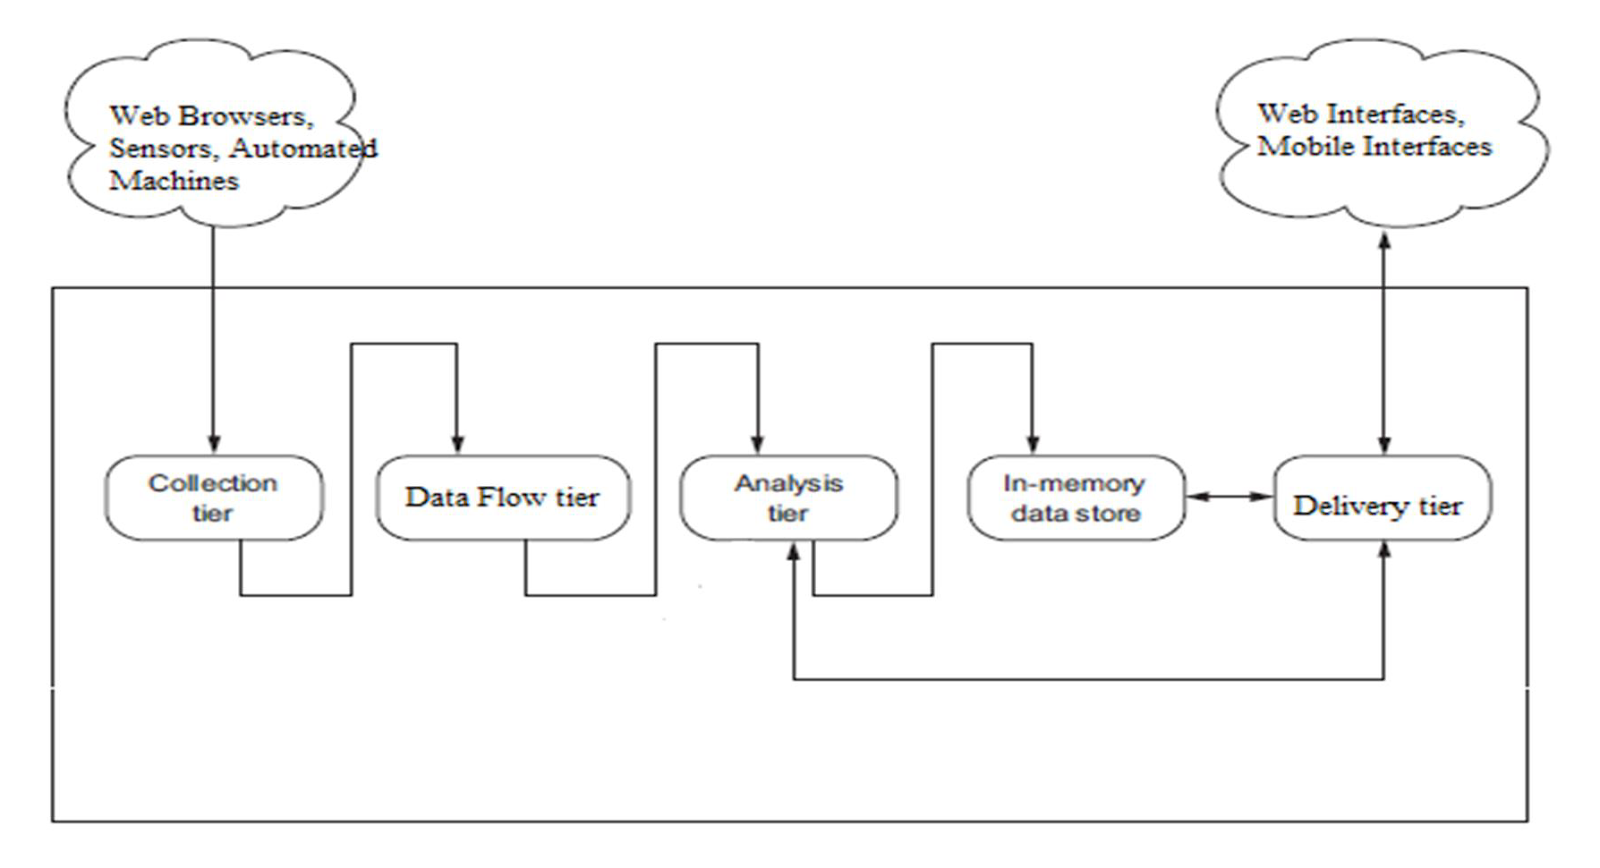
Streaming Data System Architecture Components
• Collection
• Data Flow
• Processing
• Storage
• Delivery


Collection System 

• Mostly communication over TCP/IP network using HTTP
• Websites log data was the initial days use case
• W3C standard log data format was used
• Newer formats like JSON, AVRO, Thrift are available now
• Collection happens at specialized servers called edge servers
• Collection process is usually application specific
• New servers integrates directly with data flow systems
• Old servers may or may not integrate directly with data flow systems

Data Flow Tier

• Separation between collection tier and processing layer is required
• Rates at which these systems works are different
• What if one of system is not able to cope with another system?
• Required intermediate layer that takes responsibility of
• accepting messages / events from collection layer
• providing those messages / events to processing layer
• Real time interface to data layer for both producers and consumers of data
• Helps in guaranteeing the “at least once” semantics

Processing / Analytics Tier

• Based on “data locality” principle
• Move the software / code to a the location of data
• Rely on distributed processing of data
• Framework does the most of the heavy lifting of data partitioning, job scheduling, job managing
• Available Frameworks
• Apache Storm
• Apache Spark (Streaming)
• Apache Kafka Streaming etc

Storage Tier

In memory or permanent
• Usually in memory as data is processed once
• But can have use cases where events / outcomes needs to be persisted as well
• NoSQL databases becoming popular choice for permanent storage
• MongoDB
• Cassandra
• But usage varies as per the use case, still no database that fits all use cases

Delivery Layer  

• Usually web based interface
    • Now a days mobile interfaces are becoming quite popular
    • Dashboards are built with streaming visualizations that gets continuously updated as
underlying events are processed
    • HTML + CSS + Java script + Websockets can be used to create interfaces and update
them
    • HTML5 elements can be used to render interfaces
    • SVG, PDF formats used to render the outcomes
• Monitoring / Alerting Use cases
• Feeding data to downstream applications


---------------------------------------------------------------------------- 
All the messages below are just forwarded messages if some one feels hurt about it please add your comments we will remove the post.Host/author is not responsible for these posts.

Monday, January 9, 2023

BITS-WILP-BDS-Regular 2023-Mid Semester

===================================================================

Name : MTDSE CLUSTER-MID SEM-1st Sem 2022-2023 EC-2R Jan23
Subject : DSECLZG522 
               BIG DATA SYSTEMS EC 2R
===================================================================

Q1. Discuss briefly 3 key issues that will impact the performance of a data parallel application and need careful optimization. 

Q2. The CPU of a movie streaming server has L1 cache reference of 0.5 ns and main memory reference of 100 ns. The L1 cache hit during peak hours was found to be 23% of the total memory references.         [Marks: 4]

  1. Calculate the cache hit ratio h.
  2. Find out the average time (Tavg) to access the memory.
  3. If the size of the cache memory is doubled, what will be the impact on h and Tavg.
  4. If there is a total failure of the cache memory, calculate h and Tavg.

Q3. A travel review site stores (user, hotel, review) tuples in a data store. E.g. tuple is (“user1”, “hotel ABC”, “<review>”). The data analysis team wants to know which user has written the most reviews and the hotel that has been reviewed the most. Write MapReduce pseudo-code to answer this question.         [Marks: 4]

Q4. An e-commerce site stores (user, product, rating) tuples for data analysis. E.g. tuple is (“user1”, “product_x”, 3), where rating is from 1-10 with 10 being the best. A user can rate many products and products can be rated by many users. Write MapReduce pseudo-code to find the range (min and max) of ratings received for each product. So each output record contains (<product>, <min rating> to <max rating>).              [Marks: 4]

Q5. Name a system and explain how it utilises the concepts of data and tree parallelism.           [Marks: 3]

Q6. An enterprise application consists of a 2 node active-active application server cluster connected to a 2 node active-passive database (DB) cluster. Both tiers need to be working for the system to be available. Over a long period of time it has been observed that an application server node fails every 100 days and a DB server node fails every 50 days. A passive DB node takes 12 hours to take over from the failed active node. Answer the following questions.            [Marks: 4]

  1. What is the overall MTTF of the 2-tier system ?
  2. Assume only a single failure at any time, either in the App tier or in the DB tier, and an equal probability of an App or a DB node failure. What is your estimate of the availability of the 2-tier system ?

Q7. In the following application scenarios, point out what is most important - consistency or availability, when a system failure results in a network partition in the backend distributed DB. Explain briefly the reason behind your answer.          [Marks: 4]

(a) A limited quantity discount offer on a product for 100 items at an online retail store is almost 98% claimed. (b) An online survey application records inputs from millions of users across the globe.
(c) A travel reservation website is trying to sell rooms at a destination that is seeing very few bookings.
(d) A multi-player game with virtual avatars and users from all across the world needs a set of sequential steps between team members to progress across game milestones.

Q8. Assume that you have a NoSQL database with 3 nodes and a configurable replication factor (RF). R is the number of replicas that participate to return a Read request. W is the number of replicas that need to be updated to acknowledge a Write request. In each of the cases below explain why data is consistent or in-consistent for read requests.               [Marks: 4]

1. RF=1, R=1, W=1.
2. RF=2, R=1, W=Majority/Quorum.
3. RF=3, R=2, W=Majority/Quorum.
4. RF=3, R=Majority/Quorum, W=3.


---------------------------------------------------------------------------- 
All the messages below are just forwarded messages if some one feels hurt about it please add your comments we will remove the post. Host/author is not responsible for these posts.

BITS-WILP-SPA-Makeup 2021- Final Semester

Birla Institute of Technology & Science, Pilani

Work Integrated Learning Programmes Division

Second Semester 2020-2021


Comprehensive Examination

(EC-3 Make-up)


Course No. :  DSECL ZG556

Course Title :  STREAM PROCESSING AND ANALYTICS

Nature of Exam :  Open Book 

Weightage :  45% 

Duration :  2 Hours 

Date of Exam :  11-09-2021  FN

Note to Students: 

  1. Please follow all the Instructions to Candidates given on the cover page of the answer book.

  2. All parts of a question should be answered consecutively. Each answer should start from a fresh page.  

  3. Assumptions made if any, should be stated clearly at the beginning of your answer. 


Q1. Every day a multinational online taxi dispatch company gathers terabytes of event data from its mobile users. By using Kafka, Spark Streaming, and HDFS, to build a continuous ETL pipeline, they can convert raw unstructured event data into structured data as it is collected, and then use it for further and more complex analytics.                                                                                                                            [5 + 5 = 10]

  1. With this scenario in mind, explain how Spark Streaming will be leveraged as solution using a nicely labelled architecture diagram? 

  2. List and briefly explain the Apache Spark API's that can be used in? 

Q.2. Consider the following Kafka Cluster description.                                      

  • 10 node cluster

  • Name of the Topic: Cluster

  • Number of Partitions: 4

  • The Replication factor of ‘Bus: 3

  • 7 producers

  • 5 consumers

  1. Draw Kafka’s architecture clearly highlighting the following in a block diagram

-producers, consumers, broker, topic and partitions. 

  1. How many consumer groups can be created for this configuration?

  2. What is the maximum number of consumers that each consumer group can have while ensuring maximum parallelism?

  3. What is the maximum number of server failures that this setup can handle?

[2 + 1 + 1 + 1 = 5]


Q.3. Explain the various components available in the Apache Flink with suitable real time example.                                                    

                                                                                                                                                         [10]


Q4. Consider an online ecommerce portal where customers can search for the products anonymously but for placing the order, they need to have the account with the provider. When customers are browsing the products on the portal, their online behavior is getting monitored by the provider. The provider has business relationship with another online movie service provider whose movies are also displayed and sold on the provider’s platform. Also the users search queries are shared between these providers. The search queries are also matched with the users profile to provide product / movie recommendations to the users. For this purpose it makes use of Apache Storm as streaming platform. With the help of suitable architectural diagram, represent how this recommendation activity can be carried out.                                                                    [8]                                                                                                                                


Q5. Consider the following streaming SQL query where an output record (or row) is generated specifying the updates to the minimum and maximum temperatures over the window W1, plus an incrementally updated average for the temperature over that period.                                                                                    [3 * 4 = 12]


   SELECT STREAM    

         MIN(TEMP) OVER W1 AS WMIN_TEMP,

         MAX(TEMP) OVER W1 AS WMAX_TEMP,

         AVG(TEMP) OVER W1 AS WAVG_TEMP

    FROM WEATHERSTREAM

    WINDOW W1


Let’s assume that input streaming weather stream has following temperature values coming in at regular interval of two minutes:

{12, 14, 15, 13, 16, 20}


What will be the output of the above query (with proper explanation) if

  1. Window is defined as sliding window of length 3 

  2. Window is defined as batch window of length 3 

  3. Window is defined as sliding window of time 4 minutes

  4. Window is defined as batch window of time 3 minutes


---------------------------------------------------------------------------- 
All the messages below are just forwarded messages if some one feels hurt about it please add your comments we will remove the post. Host/author is not responsible for these posts.

BITS-WILP-SPA-Regular 2020-Mid Semester

Birla Institute of Technology & Science, Pilani
Work Integrated Learning Programmes Division

Second Semester 2019-2020
Mid-Semester Test
(EC-2 Regular)

Course No. : DSECLZG556
Course Title : Stream Processing & Analytics
Nature of Exam : Closed Book
Weightage : 30%
Duration : 2 Hours
Date of Exam :

Note to Students:
1. Please follow all the Instructions to Candidates given on the cover page of the answer book.
2. All parts of a question should be answered consecutively. Each answer should start from a fresh page.
3. Assumptions made if any, should be stated clearly at the beginning of your answer.
----------------------------------------------------------------------------------------------------------------

Q.1. What are streaming data systems? Explain the Generalized Streaming Data architecture and
its various components? [6]

Q.2. For parliamentary elections vote counting updates, a system has been developed which can
be used by interested parties to receive the vote counting related updates. Each constituency is
divided into six blocks. Each block has several voting centers in it. Counting is done center wise
which approximately takes 30 minutes for each center. Once the counting for all the centers in a
block is done then the central system is notified about the latest state of votes received by various
candidates. Giving three reasons, Justify whether the above described system is case of streaming
data or not. [6]

Q.3 Compare the different streaming data delivery protocols with respect to the following points:
I. Message frequency
II. Communication direction
III. Message Latency
IV. Efficiency [6]

Q.4 Consider an international airline which operates both in passenger segment and cargo segment.
For every flight that is flying, the airline captures a lot of data in real time which can be used for
live tracking of flight status, modelling the flight schedules as well as for preventive maintenance
schedule etc. Also, at the same time, the same data was used for various analytical purposes which
are oriented towards improving the airline operations and also for the predicting the passenger
loads, cargo loads in near future and devising the marketing strategies around it. Identify the
appropriate data processing architecture that can help in achieving these use cases. With a help of
architectural diagram, represent the proposed system architecture. [6]
No. of Questions = 05


Q.5 A producer produces messages which are fed to a Kafka topic which has three partitions into
it. Another producer produces messages which are fed to the earlier mentioned Kafka topic as
well as into a different Kafka topic having two partitions into it. There are 6 Kafka brokers in the
system and 3 consumers out of which first two listens to the Kafka topic partitions of first topic
whereas the last one listens to the partitions of second Kafka topic. For each topic partition, 2
replicas are maintained in the cluster. Draw a suitable Kafka Cluster architectural diagram
fulfilling the above-mentioned requirements. [6]


---------------------------------------------------------------------------- 
All the messages below are just forwarded messages if some one feels hurt about it please add your comments we will remove the post. Host/author is not responsible for these posts.

Thursday, January 5, 2023

Hadoop 2 - Architecture


---------------------------------------------------------------------------- 
All the messages below are just forwarded messages if some one feels hurt about it please add your comments we will remove the post. Host/author is not responsible for these posts.

MapReduce Programming Architecture and flow

1.Input dataset is split into multiple pieces of data (several small sets)
2.Framework creates a master and several worker processes and executes the worker processes remotely
3.Several Map tasks work simultaneously and read pieces of data that were assigned to each map. Map worker uses the
map function to extract only those data that are present on their server and generates key/value pair for the extracted
data.
4.Map worker uses partitioner function to divide the data into regions. Partitioner decides which reducer should get the
output of specified mapper.
5.When the map workers complete their work, the master instructs the reduce workers to begin their work.
6.The reduce workers in turn contact the map workers to get the key/value data for their partition (shuffle). The data thus
received from various mappers is merge sorted as per keys.
7.Then it calls reduce function on every unique key. This function writes output to the file.
8.When all the reduce workers complete their work, the master transfers the control to the user program.


---------------------------------------------------------------------------- 
All the messages below are just forwarded messages if some one feels hurt about it please add your comments we will remove the post. Host/author is not responsible for these posts.

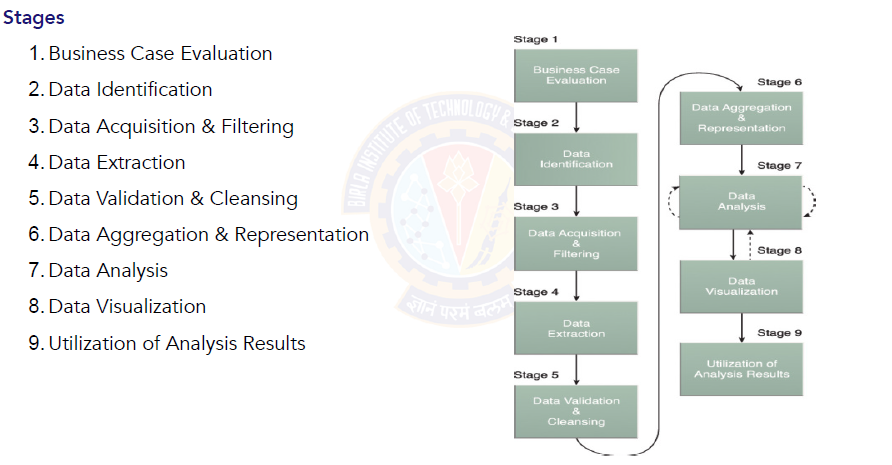
Big Data Analytics Lifecycle


---------------------------------------------------------------------------- 
All the messages below are just forwarded messages if some one feels hurt about it please add your comments we will remove the post. Host/author is not responsible for these posts.

Mean Time Failure and other Formulas

Important formula for Mean Time Failures


MTTF - Mean Time To Failure
 MTTF = 1 / failure rate = Total #hours of operation / Total #units
 MTTF is an averaged value. In reality failure rate changes over time
because it may depend on age of component.

 Failure rate = 1 / MTTF (assuming average value over time)

 MTTR - Mean Time to Recovery / Repair
 MTTR = Total #hours for maintenance / Total #repairs

 MTTD - Mean Time to Diagnose

 MTBF - Mean Time Between Failures
 MTBF = MTTD + MTTR + MTTF


MTTF - Serial assembly 

 MTTF of system = 1 / SUM (1/MTTFi) for all components i
 Failure rate of system = SUM(1/MTTFi) for all components i

MTTF - Parallel assembly 

MTTF of system = SUM(MTTFi) for all components i

 Availability = Time system is UP and accessible / Total time observed

 Availability = MTTF / (MTTD* + MTTR + MTTF)
or
 Availability = MTTF / MTBF

---------------------------------------------------------------------------- 
All the messages  below are just forwarded messages if some one feels hurt about it please add your comments we will remove the post. Host/author is not responsible for these posts.

Wednesday, January 4, 2023

Cache performance and Access time of memories

• Cache hit
✓ When CPU refers to memory and find the data or instruction within the Cache Memory
• Cache miss
✓ If the desired data or instruction is not found in the cache memory and CPU refers to the
main memory to find that data or instruction
Hit + Miss = Total CPU Reference
Hit Ratio h = Hit / ( Hit + Miss )

Average access time of any memory system consists of two levels:
✓ Cache Memory
✓ Main Memory
• If Tc is time to access cache memory and Tm is the time to access main
memory and h is the cache hit ration, then
Tavg = Average time to access memory
Tavg = h * Tc + ( 1-h ) * ( Tm + Tc )

---------------------------------------------------------------------------- 
All the messages below are just forwarded messages if some one feels hurt about it please add your comments we will remove the post.
Host/author is not responsible for these posts.

Big Data Architecture Challenges


---------------------------------------------------------------------------- 
All the messages below are just forwarded messages if some one feels hurt about it please add your comments we will remove the post. Host/author is not responsible for these posts.

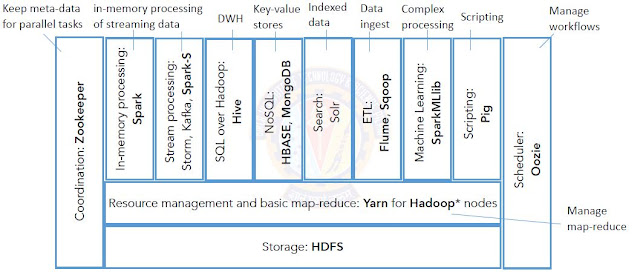
Apache Technology Ecosystem


---------------------------------------------------------------------------- 
All the messages below are just forwarded messages if some one feels hurt about it please add your comments we will remove the post. Host/author is not responsible for these posts.

Big Data architecture style


---------------------------------------------------------------------------- 
All the messages below are just forwarded messages if some one feels hurt about it please add your comments we will remove the post. Host/author is not responsible for these posts.

Tf-IDf in information Retrieval

The tf-idf (term frequency-inverse document frequency) is a measure of the importance of a word in a document or a collection of documents. It is commonly used in information retrieval and natural language processing tasks.

The formula for calculating tf-idf is:

tf-idf = tf * idf

where:

  • tf (term frequency) is the frequency of the word in the document. It can be calculated as the number of times the word appears in the document divided by the total number of words in the document.

  • idf (inverse document frequency) is a measure of the rarity of the word. It can be calculated as the logarithm of the total number of documents divided by the number of documents that contain the word.

The resulting tf-idf score for a word reflects both the importance of the word in the specific document and its rarity in the collection of documents. Words that are common across all documents will have a lower tf-idf score, while words that are specific to a particular document and rare in the collection will have a higher tf-idf score.

----------------------------------

The tf-idf (term frequency-inverse document frequency) is a measure of the importance of a word in a document or a collection of documents. It is commonly used in information retrieval and natural language processing tasks.

The formula for calculating tf-idf is:

tf-idf = tf * idf

where:

  • tf (term frequency) is the frequency of the word in the document. It can be calculated as the number of times the word appears in the document divided by the total number of words in the document.

  • idf (inverse document frequency) is a measure of the rarity of the word. It can be calculated as the logarithm of the total number of documents divided by the number of documents that contain the word.

The resulting tf-idf score for a word reflects both the importance of the word in the specific document and its rarity in the collection of documents. Words that are common across all documents will have a lower tf-idf score, while words that are specific to a particular document and rare in the collection will have a higher tf-idf score.

----------------------


---------------------------------------------------------------------------- 
All the messages below are just forwarded messages if some one feels hurt about it please add your comments we will remove the post. Host/author is not responsible for these posts.

Jaccard Coefficient - Information Retrieval


Links : Example

----------------------------------------------------------------------------
 All the messages below are just forwarded messages if some one feels hurt about it please add your comments we will remove the post. Host/author is not responsible for these posts.

Minimum Edit Distance - Information Retrieval


Useful links : Link1
                      Execution2Intention Example


---------------------------------------------------------------------------- 
All the messages below are just forwarded messages if some one feels hurt about it please add your comments we will remove the post. Host/author is not responsible for these posts.

K-Gram Index (Bigram Indexes) - Information Retrieval


K Gram example : Stanford

---------------------------------------------------------------------------- 
All the messages below are just forwarded messages if some one feels hurt about it please add your comments we will remove the post. Host/author is not responsible for these posts.